Static maps for USA
mappingUS.RdFunction to produce static maps for USA unit.
Usage
mappingUS(data, var = NULL, colID = NULL,
          type = c("static", "interactive"),
          typeStatic = c("tmap", "choro.cart", "typo", "bar"),
          unit = c("country", "region", "division","state",
                   "county", "district", "district_county", "urban_area"),
          year = c("2018"), matchWith = c("name", "id", "number"),
          scale = c("20", "50", "500"), dir = NULL, show_us = TRUE,
          add_text = NULL, subset = NULL, facets = NULL,
          aggregation_fun = sum, aggregation_unit = NULL,
          options = mapping.options())
Arguments
- data
a data.frame object with variables to display or a
USobject produced byUSfunction- var
character value(s) or columns number(s) indicating the variable to plot
- colID
character value or columns number indicating the column with unit names
- type
if generates static or interactive map
- typeStatic
type of static map
- unit
the type of European statistical unit to check.
- year
year of the unit
- matchWith
the type of id to check if unit is set to "states"
- scale
the scale of a map
- dir
local directory in which shape files are stored
- show_us
logical value set to TRUE indicating if the map entire map is drawn or only the coordinates linked to the input data
- add_text
character name indicating the column with text labels
- subset
a formula indicating the condition to subset the data. See the details section
- facets
variable(s) name to split the data
- aggregation_fun
function to use when data are aggregated
- aggregation_unit
variable name by which the unit are aggregated
- options
a list with options using
mapping.optionsfunction
Details
If data is a object of class "US" generated using the US function, the arguments unit, year, and matchWith are ignored, because the object already contains the coordinates.
The aggregation_unit provides an aggregation for a user specified variable in data, or for larger statistical unit, automatically provided when the function link the data with the coordinates. For example, if data are of type county, we will have variables for larger aggregate unit, that is state and region variables. Look at US for more details.
subset provide an expression to subsetting the data using a formula, with the logical operators. For example data can be subsetting as follows: ~I("Variable 1" == "condition 1" & "Variable 2" != "condition 2") or for example, ~I("Variable 1" > "condition 1" | "Variable 2" != "condition 2").
References
Giraud, T. and Lambert, N. (2016). cartography: Create and Integrate Maps in your R Workflow. JOSS, 1(4). doi: 10.21105/joss.00054.
Pebesma, E., 2018. Simple Features for R: Standardized Support for Spatial Vector Data. The R Journal 10 (1), 439-446, https://doi.org/10.32614/RJ-2018-009
Tennekes M (2018). “tmap: Thematic Maps in R.” _Journalstatisticaltical Software_, *84*(6), 1-39. doi: 10.18637/jss.v084.i06 (URL: https://doi.org/10.18637/jss.v084.i06).
Examples
data("popUS")
us <- US(data = popUS, unit = "state")
###############
# Statics #
###############
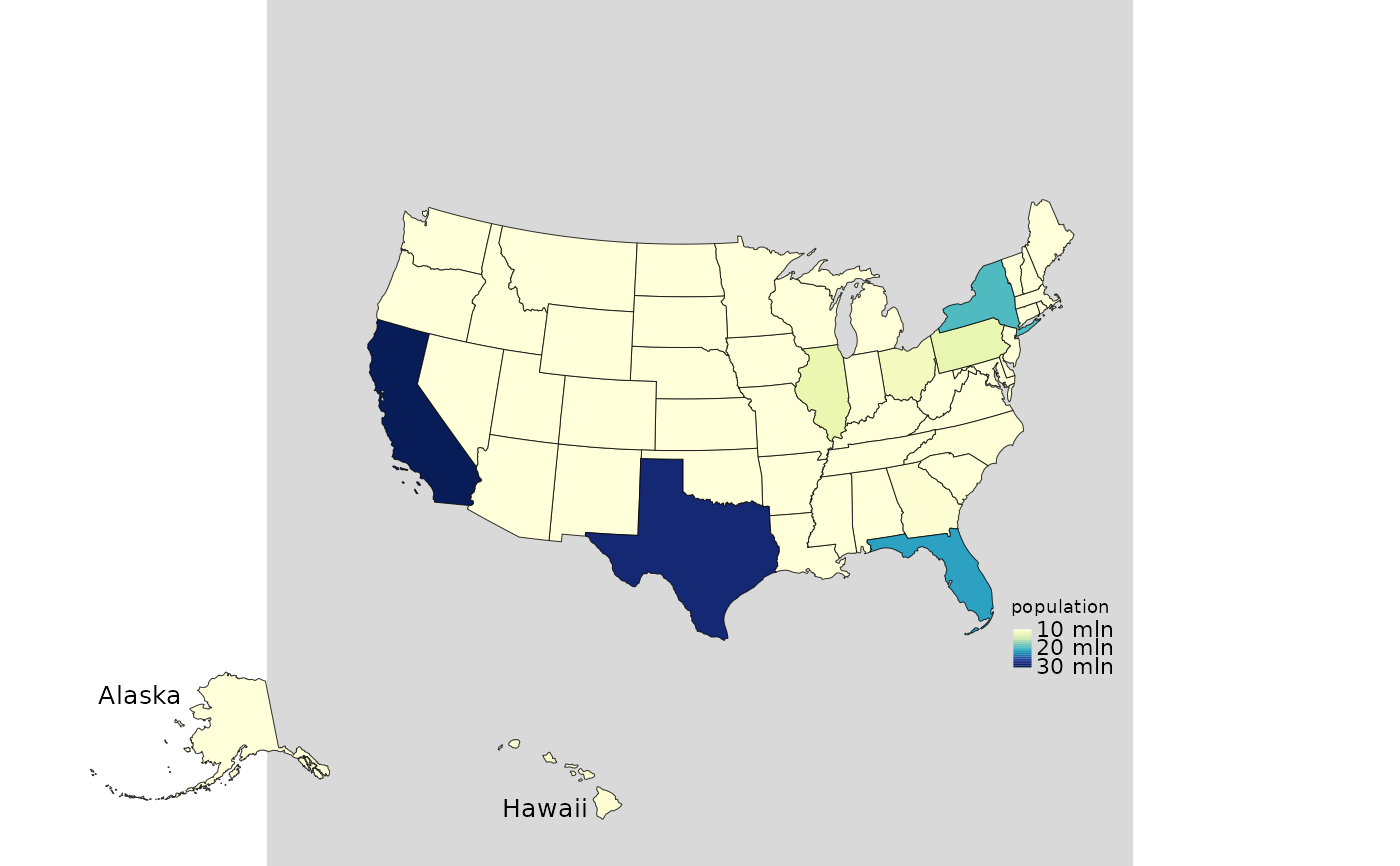
mappingUS(data = us, var = "population")
 #> Warning: Values have found that are less than the lowest break
#> Warning: Values have found that are higher than the highest break
#> Warning: Values have found that are less than the lowest break
#> Warning: Values have found that are higher than the highest break
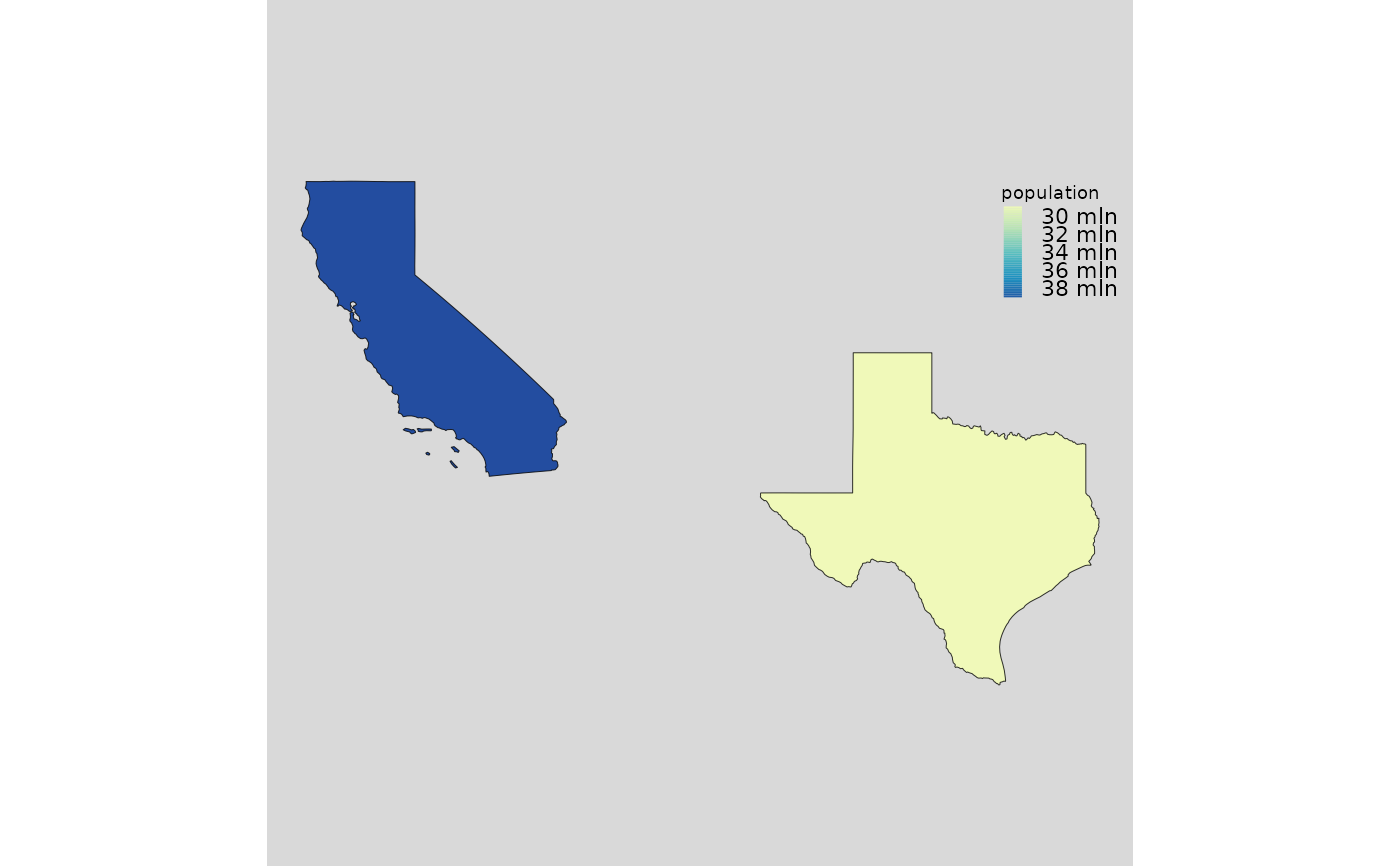
 mappingUS(data = us, var = "population",
subset = ~I(id == "california" | id == "texas"))
mappingUS(data = us, var = "population",
subset = ~I(id == "california" | id == "texas"))
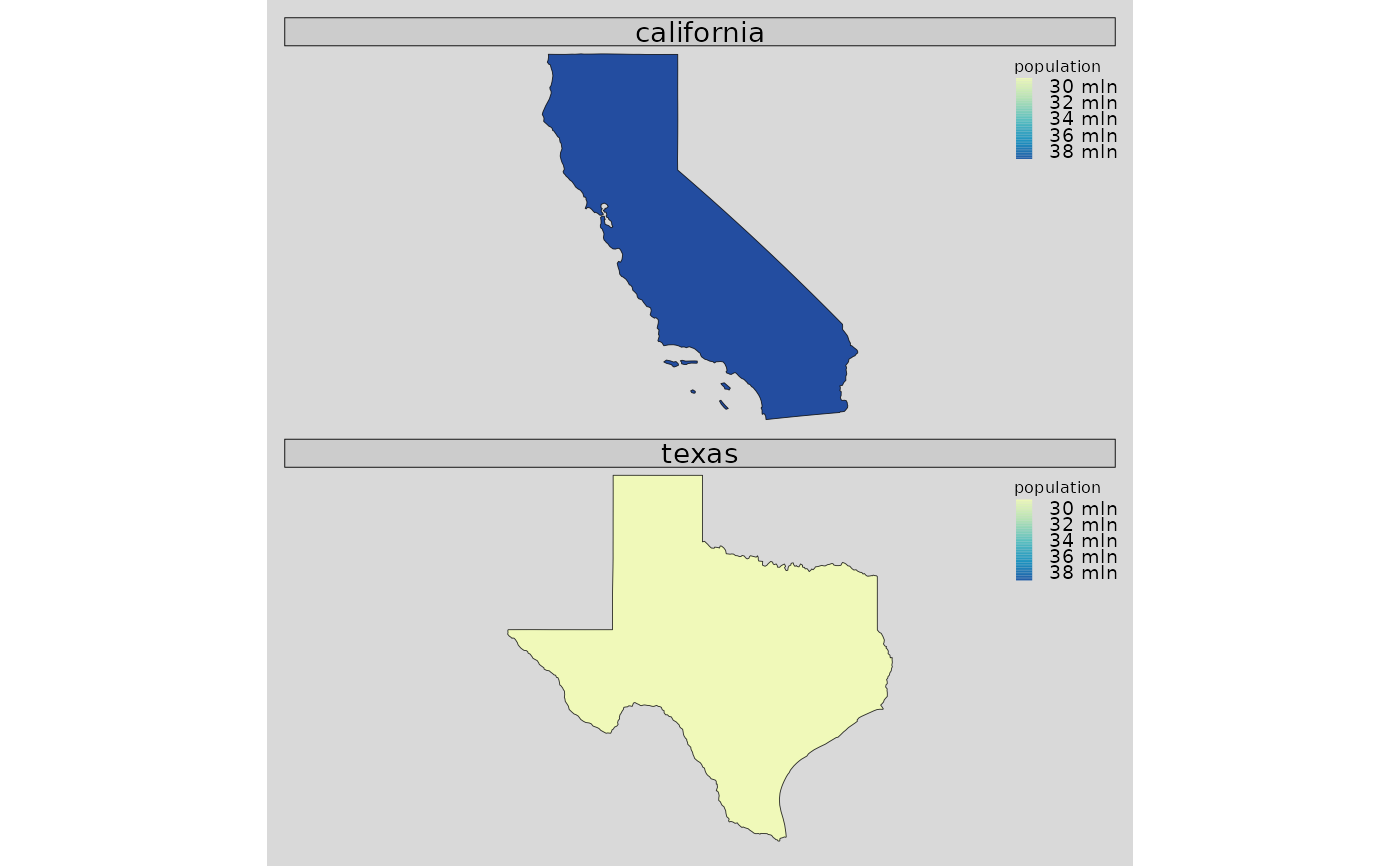
 mappingUS(data = us, var = "population",
subset = ~I(id == "california" | id == "texas"), facets = "id")
mappingUS(data = us, var = "population",
subset = ~I(id == "california" | id == "texas"), facets = "id")
 # \donttest{
mappingUS(data = us, var = "population", typeStatic = "choro.cart")
###############
# Interactive #
###############
mappingUS(data = us, var = "population", type = "interactive")
mappingUS(data = us, var = "population", type = "interactive",
subset = ~I(id == "california" | id == "texas" | id == "new york" ))
# }
# \donttest{
mappingUS(data = us, var = "population", typeStatic = "choro.cart")
###############
# Interactive #
###############
mappingUS(data = us, var = "population", type = "interactive")
mappingUS(data = us, var = "population", type = "interactive",
subset = ~I(id == "california" | id == "texas" | id == "new york" ))
# }